
Do the maths for people
Make the maths task as easy as possible or get rid of calculations altogether. This includes converting percentages and decimals for people where possible, and making sure people don’t have to compare numbers without the same denominator or format.
| Do not | Do |
|---|---|
| Advise someone they need to lose at least 5% of their body weight | Advise someone to lose at least __kg |
| Say “20% of adults” | Say “1 in 5 adults” |
| Say “1 in 5 people have ____. If you are over 65, your risk increases to 1 in 4” | Say “4 in 20 people have ___. The risk is higher for older people, with 5 in 20 people over 65 years having _____” [also show this visually] |
Formatting numerical information
- Use plenty of white space around information (about half the space on the page).
- Put simple captions next to numerical information or visuals.
- If getting people to rate something, make the larger number represent the desirable score, e.g. rate your knowledge from 1 to 5 (5 representing the most knowledge).
- Only include the most important information, not the “nice to know”, e.g. patients probably do not need confidence intervals on graphs.
- Use numbers rather than words (“1” instead of “one”).
Use visuals to help with understanding
- Use visuals only if the visual is easy to understand.
| Do not | Do |
|---|---|
| Use a complicated table or graph that may make things harder, e.g. with multiple categories being compared, multiple types of graphs (line overlaid over bar graph). |
Use simple ways of presenting information, like iconarray.com, or a visual pain scale, medication schedules. Simple bar charts and risk ladders are also generally understood. |
- Only represent one idea per graph and limit the number of categories.
- Be wary of colour in visuals, e.g. some people may link red with ‘danger’, other people have trouble telling colours apart. Make sure your colour has high contrast with the background.
- Patient decision aids that use visual representation of data increase knowledge and help patients clarify values.
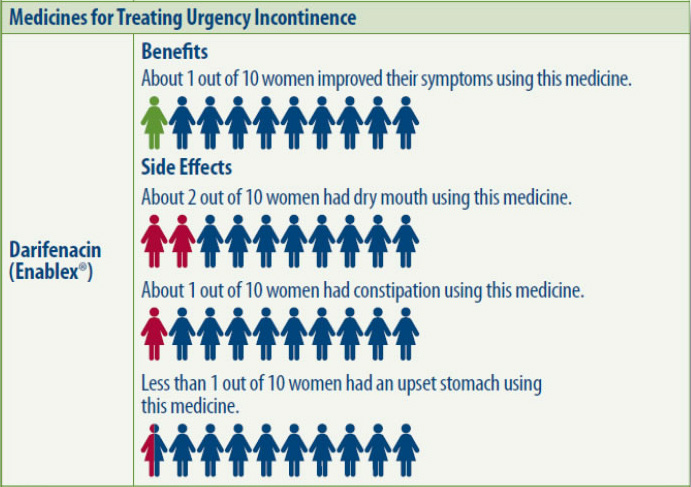 Image from ARHQ
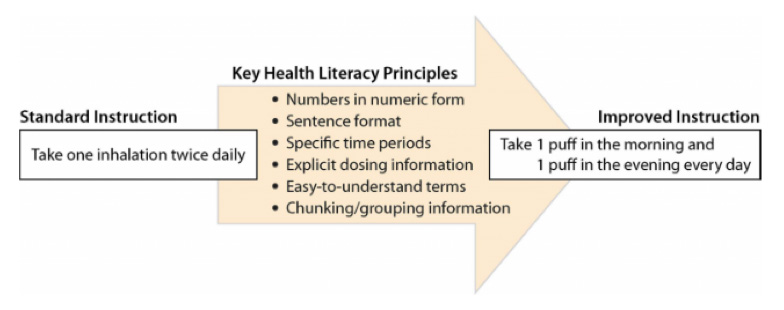
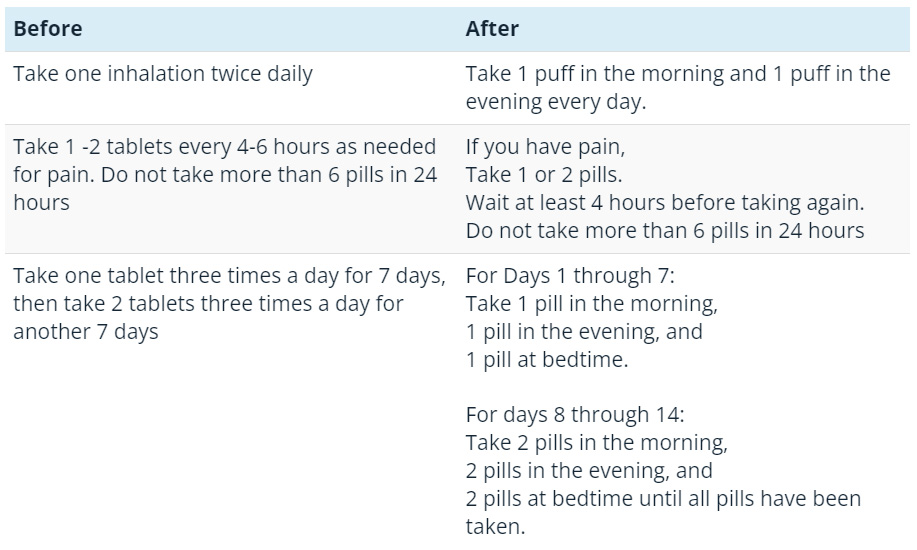
Use plain language
- Separate out instructions/tasks.
- Use words people understand instead of numerical words that are unfamiliar to people.
Do not Do Use words like ‘relative risk’, ‘correlation’, ‘longitudinal’. Explain concepts in words that people understand and relate it to their situation, e.g. “this study looked at women over a period of 50 years and found that…” - Use relatable terms.
Do not Do Say “49%” Say “about half” Say “negative test” Say “your test shows you do not have_____”
Make numbers meaningful for people
- Provide personal context for people, e.g. compare someone’s test results with their previous test results, or with people of similar age or health condition
- Summarise the information after each idea so the person can answer, “what does this mean for me?”
Use analogies
- Compare things to familiar objects.
Do not Do Use measurements that people cannot contextualise. Compare measurement information to recognised objects. “Your gallstone was half a centimetre” “A gallstone can be as small as a grain of sand or as large as a golf ball. Your gallstone was about half of a centimetre big, or about the size of a small green pea.” “keep 1.5metres away from others” “Keep a distance of one shopping trolley apart from others (1.5 metres)” - Add context to numbers, e.g. 3 in 1000, which is about 3 people in your school.
Check for understanding
- Only discuss one idea or a few numerical concepts at a time.
- Use teach-back to check that the person understands the message.
- Only include numbers that are necessary for the person to understand the key messages you are communicating. If numbers are not needed, focus on actions that people need to take.
- Discuss what different risks mean to different people, e.g. some may think cancer always leads to intense treatment or death.
- Check people’s understanding of cumulative risk if this is relevant to their care, e.g. not wearing sunscreen on one day when you are outside is low risk for skin cancer. Repeating this behaviour (i.e. never wearing sunscreen) increases your changes of skin cancer, and the risk gets higher over time.
Explaining risk
- Use both numbers and descriptive terms when talking about risks. Using only words, like ‘low risk’, is open to interpretation.
Do not Do Use only words, like “low risk” Use words and numbers – “The chance of getting a blood clot is low, about 2 people out of 100 people that have a stent will get a blood clot.” - Use frequency instead of decimals or percentages.
Do not Do Use decimals and/or percentages, if possible (
0.13 or 13%).Use frequencies
(13 out of 100). - When comparing risks, keep the denominator the same.
Do not Do Say, “1 in 25 people may have a reaction to medication A and 1 in 200 may react to medication B.” Many people may incorrectly think that 1 in 200 is greater than 1 in 25. Say, “40 out of 1000 people may react to medication A and 5 in 1000 people may react to medication B. There is more chance of having a reaction to medication B.” - Use the smallest possible denominator (keeping the numerator as a whole number), and for larger numbers use a base 10 as the denominator (i.e. 10, 100, 1000, 10 000).
Do not Do Use 30 in 1000 Use 3 in 100 - Use absolute risk instead of relative risk:
- Absolute risk is the estimate of the number of health events among individuals in a whole population. It gives a better and less biased idea of someone’s individual risk.
- Relative risk compares risk between subgroups. It makes risks (or benefits) seem larger and can be more persuasive.
Do not Do Say, “Smokers have 2 times the risk of having a stroke in their lifetime” Say, “3 out of 1,000 non-smokers may have a stroke in their lifetime, and 6 out of 1,000 smokers may have a stroke in their lifetime” Say, “This medication will reduce your risk of ___ by 50 percent” Say, “This medication will decrease your risk of ___ from 6 in 1,000 to 3 in 1,000”
- Be clear about who the risk is referring to, e.g. ‘women over 50’ rather than just ‘women’.
- Include time periods if appropriate to the risk, and use time periods that are relevant to the patient (e.g. 5 or 10 years).
- Be honest if the data is uncertain about risks.
Framing risk
- Frame risk in positive and negative ways so you are not biasing decisions.
Do not Do Say, “2 out of 10 people get side effects with this treatment”. Say, “With this treatment, 2 out of 10 people get side effects, and 8 out of 10 people do not get side effects.” Say, “10 out 100 people die from this surgery”. Say, “90 out 100 of people survive this surgery and 10 out of 100 will die from this surgery.” - Using other patient’s experiences to describe interventions can create bias.
- Positive framing can reduce the ‘nocebo’ effect, e.g. “95 in 100 people tolerate this medication well”.
Understand other impacts on people’s understanding of risk
- People draw on emotions and past experience when making judgements about their risk, e.g. if a family member died from brain cancer, it may be hard for people to understand that other types of cancer may not be as lethal or aggressive.
- People may not be as responsive to objective numerical information if it does not align with their own values, e.g. risk information about smoking.
- People often make health decisions based on the gist of information rather than remembering exact facts. We usually only remember the gist of a conversation or experience. Our brains will make the rest of the decision using a mix of emotion, past experience and our existing knowledge about the topic. Basically, our brain tries to put together a simple message or summary of a conversation. This is harder for it to do if we bombard people with lots of complex information. A person is also more likely to arrive at a certain ‘gist’ if it relates to a belief they already have (e.g. I don’t need sunscreen because I don’t have pale skin). Always check that a person has understood your intended meaning.
Resources
- Making Data Talk: A Workbook (cancer.gov) – This book helps you select and communicate quantitative data in ways lay audiences can understand
- The Ottawa Patient Decision Aids Inventory. – A to Z Inventory of Decision Aids
- realrisk.wintoncentre.uk – Online tool aimed at journalists communicating health risk research. It converts specialist statistics into absolute risks and displays them as text, icon arrays and bar charts.


 Northern NSW Health Literacy Project acknowledges the traditional custodians of the lands across our region and pays respect to the Elders past, present and emerging. We recognise these lands were never ceded and acknowledge the continuation of culture and connection to land, sky and sea. We acknowledge Aboriginal and Torres Strait Islander peoples as Australia’s First Peoples and honour the rich diversity of the world’s oldest living cultures.